I am working on several projects, most of which continue past research. Some information and pictures outlining these projects are listed below. I involve students in my work, and I’m always looking for graduate and undergraduate students to help in these projects.
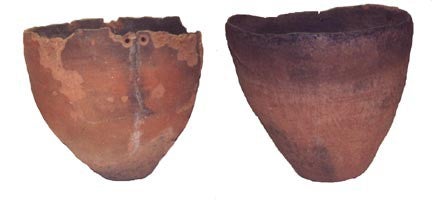
Two whole brownware pots from Owens Valley, curated at the Eastern California Museum.
For some time now, I’ve been studying brownware pottery in the Western Great Basin. My dissertation examined why pottery was adopted by Paiute and Shoshone hunter-gatherers. Pottery use is relatively rare among mobile hunting and gathering societies, so what prompted these people to engage in the technology? Studying the function of pots through attribute and residue analyses, and the social context of pots through sourcing, helped me to examine this question. I am currently writing articles for publication on the results of this work and trying to extend the research in new directions.
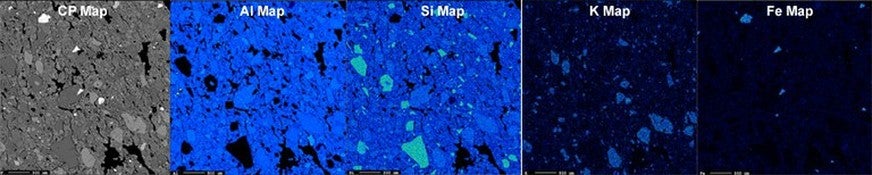
I have been looking at thin sections of pottery obtained using the Electron Microprobe (EM). Previously I had analyzed pottery using Instrumental Neutron Activation Analysis, which gives data on bulk pottery samples. Although with decreased compositional precision, the microprobe allows the analyst to look at very small areas (ca. microns) within the sample. This allows one to characterize individual temper grains or the paste separately. Using this technique it is possible to determine where certain elements are concentrated within a pottery sample, whether within the paste or temper. Early results suggest that most of the compositional variability in Western Great Basin pots can be accounted for by the mineralogy of temper constituents, rather than the clay.
This figure shows five EM scans of the same sherd. The one on the left is the overall backscattered electron map. Then in succeeding images, Aluminum (Al), Silicon (Si), Potassium (K), and Iron (Fe). As can be seen, different elements are brighter in the different scans, indicating higher concentrations. The Al map shows the clay paste in brightest color (since clays are aluminosilicates). The Si map, highlights quartz grains (Si O2). The Potassium map highlights the Potassium feldspars. And the iron map highlights grains of hematite and magnetite (Fe2O3 and Fe3O4). From such maps we can compare the density, average size, average roundedness, etc. of different temper constitutents.
I also work with Kevin Vaughn of Purdue University (see Dr. Vaughn’s website for more information) in the Nasca region of Peru. We are engaged in several projects including:
Understanding the Late Archaic (3500 – 1800 BC) spanning the transition from hunting and gathering to agriculture
Establishing an obsidian hydration rate
Tracking long-distance trade & movement of obsidian artifacts to specific sources
Exploring the mineralogy of pigments used on Nasca pottery
Understanding the organization of mineral mining during the Nasca period
Testing the Nasca pottery chronology using luminescence dating
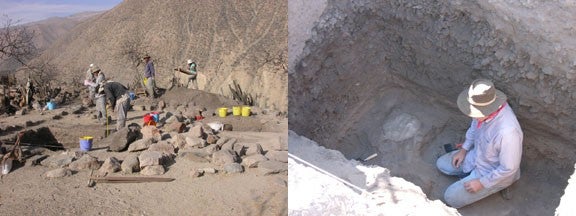
Photos of excavations at Upanca, an Early Nasca and Archaic-period site in the Tierras Blancas Valley, near Nasca Peru. On the right I am excavating a small hearth at the bottom of the cultural deposit, radiocarbon dated to about 5300 years ago.
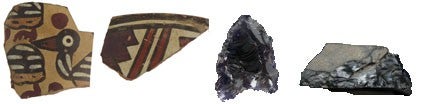
Photo of two Nasca-period sherds (ca. 1500 BP) on the left, a basally-notched projectile point (ca. 3500 BP) third from left, and an obsidian scraper on the far right (ca. 5000 BP). Our research in the Nasca region is focusing on these kinds of artifacts.
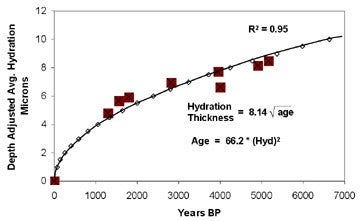
At left is our first preliminary attempt at establishing a hydration rate for the Nasca region (paper presented at the 2007 SAA meetings). The graph shows radiocarbon-hydration pairings (all obsidian from Quispisisa source), along with a best-fit regression line. The regression is quite good – we are pleased, suggesting that obsidian hydration is an effective means of dating sites in the Nasca region. At right is image of what we believe is a mining base camp in one of the quebradas (Quebrada de Pongo) off the Aja River Valley. Cerro Blanco is in the background.
My research also includes examining the interplay between humans and material technology within an evolutionary framework. I am particularly interested in how cultural transmission and manual production of artifacts results in variability within artifact assemblages. Thus, how imprecision (or variability) results from the transfer of a mental image of something into the actual object. Currently I am trying to model how such imprecision accumulates over large time-scales from an evolutionary viewpoint, somewhat analogous to genetic drift, to get a better sense for what we might call “cultural drift.”
With funding from the National Science Foundation, we have been developing a method for tracking the origin of marine shell beads with colleagues Jeff Rosenthal, Greg Herbert, and Howard Spero, using oxygen and carbon isotopic signatures. The ultimate goal is to track shell bead exchange in prehistoric California. We are also examining chemical compositional signatures (i.e., amount of Iron, Chromium, etc.), and have built a database for Olivella biplicata shells collected along the California coast. As well we have analyzed over 100 beads to date. Two articles have been published and can be downloaded if you follow the link. We are now working with shell beads from sites around the state, matching beads to raw shell from the coast. Hopefully, we will then be able to reconstruct how different areas contributed shell beads to the pan-Californian exchange system in Olivella, and how those exchange systems changed through time.
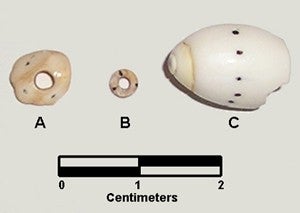
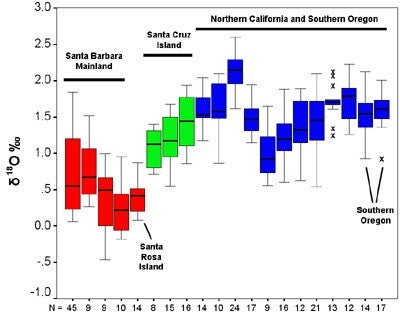
The images above show some Olivella biplicata beads and a modern shell, and where we took isotope samples. The image on the right shows how oxygen isotopes serve to separate Olivella shells collected in Southern California and Santa Rosa Island (in red), from those collected in Northern California and Oregon (in blue). The Santa Cruz Island shells, in green, are posing some problems here as they are falling in between these extremes, thus, the situation is more complex than we had originally hoped. More recent analyses are suggesting the Santa Cruz shells we sampled are anomalous. This is something we will be working on. In any case, our analyses of beads shows that different bead types tend to have distinctive isotopic profiles. This may indicate that different types were made in different regions of the coast. Our research here is ongoing.
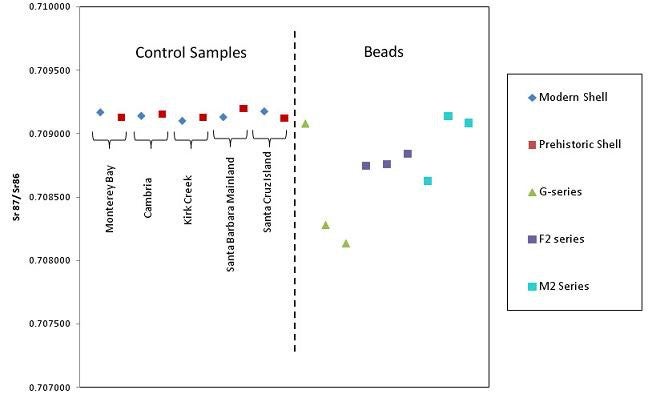
Lately we have tried to use Strontium (Sr) isotopes as a means to track shells. Undergraduate Laura Brink has been involved in this project, and we have produced some intriquing results. The image below shows Sr isotope ratios for Olivella shells, prehistoric and modern, collected from controlled locations. These are plotted on the left side of the graph. They plot exactly as we expected for shells growing in the open ocean. However, six out of nine beads we sampled show signatures that are NOT characteristic of open ocean. This suggests they were collected in estuaries with significant quantities of freshwater influx. For example, if they were produced in the San Francisco Bay area, they would have had to be growing near Suisun Marsh. Interestingly, Olivella biplicata does not tolerate the salinity conditions at Suisun Bay. Our future research will try to track the location of bead production in Northern California, which appears to not have taken place along the open Pacific Coastline, but in some other location.
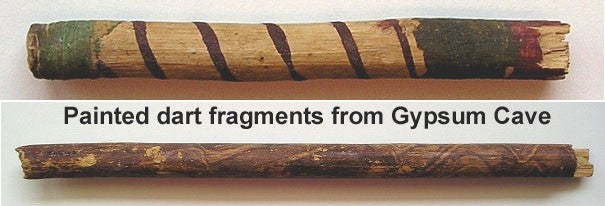
I have been using X-Ray Diffraction and Laser Ablation ICP-MS to analyze pigments on dart and arrow fragments from caves in the Western Great Basin. Our first goal is to understand what kinds of minerals were being used to make the pigments. Our second goal is to then track the mining and transportation (perhaps through exchange) of these mineral pigments across the landscape. We’ve been able to develop a method that does not require any sample destruction – thus, we are able to analyze pigments in-situ on the weaponry fragments. Below is a picture of two such dart fragments from Gypsum Cave.
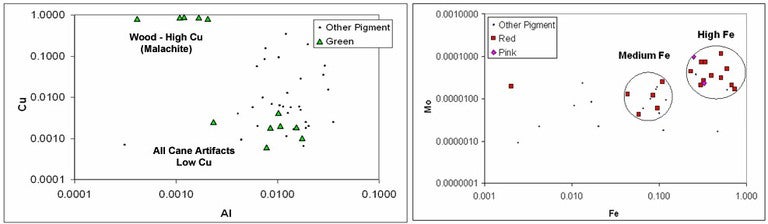
Above are shown LA-ICP-MS analyses of green and red pigments. There are two types of green; one is from the copper-based mineral malachite. The other is some kind of organic or clay pigment. The reds tend to be elevated in iron and molybdenum, but there are different recipes for red. XRD analysis shows the presence of hematite, but also dolomite, calcite, ankerite, gypsum, and quartz. Some of the latter pigments are probably binders. Gypsum and calcite were also found in the green pigments. Other interesting results so far include the use of manganese oxides for some blacks, use of some tin-oxides for brown, and a few high-zirconium reds and pinks. We’ll be doing more analyses with these pieces to learn about their mineralogy.
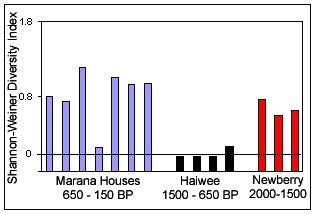
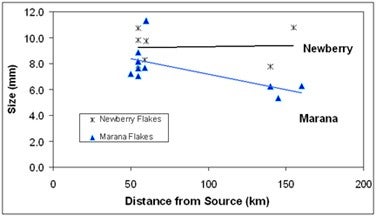
With Amy Spurling (now a grad student at University of Utah), I’ve been looking at obsidian use over time in the Southern Owens Valley. We are finding dramatically different patterns in obsidian acquisition and reduction over time. The graphs below hightlight some of these patterns. The one of the left shows obsidian source diversity in house floors by three time periods. As can be seen houses in the oldest time period (Newberry) have medium source diversity, but houses are fairly redundant in the range of sources present. We think this indicates fairly egalitarian access to obsidian. The next time period (Haiwee) shows access of only the most proximal source (Coso), and again, redundant diversity within houses. In the most recent part of prehistory (Marana period) houses have very high average diversity, indicating access to many different sources across the region, we believe through trade. Moreover, houses also show high inter-household variation. Thus, some houses were accessing obsidian from lots of different sources, others only from one or two sources. This indicates to us a switch from egalitarian access networks to much more restricted or privatized ones over time.
The image on the right above, shows diffences in obsidian reduction patterns between the Newberry and Marana periods. Newberry period reduction shows very little distance-decay. Flakes from distant sources are just as large as from more proximal sources. We think this indicates unrestricted access to obsidian by highly mobile people, likely logistical hunters who are accessing distant hunting territories and grabbing obsidian on the way. These hunters seem to have made large “jumps” across the landscape, with very little reduction of obsidian in the process. By contrast, Marana patterns show more classic “distance decay.” Again, we think trade is predominantly responsible for the movement of obsidian during the Marana period (vs. direct access in the Newberry period).